

HOT TOPICS LIST
- MACD
- Fibonacci
- RSI
- Gann
- ADXR
- Stochastics
- Volume
- Triangles
- Futures
- Cycles
- Volatility
- ZIGZAG
- MESA
- Retracement
- Aroon
INDICATORS LIST
LIST OF TOPICS
PRINT THIS ARTICLE
by Mark Rivest
Can the Brexit vote effect the trend of US stocks? Technical analysis has the answer.
Position: N/A
Mark Rivest
Independent investment advisor, trader and writer. He has written articles for Technical Analysis of Stocks & Commodities, Traders.com Advantage,Futuresmag.com and, Finance Magnates. Author of website Four Dimension Trading.
PRINT THIS ARTICLE
FIBONACCI
The Brexit Factor
06/24/16 10:12:17 PMby Mark Rivest
Can the Brexit vote effect the trend of US stocks? Technical analysis has the answer.
Position: N/A
| On June 8th the S&P 500 (SPX) reached 2120.55, the highest point since the start of the rally on February 11th and then proceeded to decline. On June 16th, one day after the FOMC announcement, it looked like the bears were in charge by bringing the SPX down more than 21 points from the prior day's close, then came a dramatic reversal with the SPX ending the day up 6 points. My June 15th article "Summer Solstice Buying Opportunity" indicated the SPX could make an important bottom near the 2000 level on June 20th. As of the close on June 17th this appears unlikely, however the SPX could still reach 2000 in the last week of June. SPX Update June 16th was a fascinating day and not just because of the dramatic reversal. The June 8 - 14 decline was 56.45 SPX points. A .382 retracement of this decline targets SPX 2085.66. The post FOMC announcement peak on June 15th was 2085.65 — bulls-eye! Additionally, if you multiply the first decline of 56.45 points by .618 it yields 34.88. Subtracting 34.88 from 2085.65 targets SPX 2050.77. The actual bottom on June 16th was 2050.37 a difference of only .40 — again, amazing precision! And there's more... On June 16th the CBOE options Total Put/Call ratio hit 1.39, which is slightly higher than the 1.37 reading made on the May 19th bottom. Reversing a decline very close to Fibonacci support accompanied by a high Put/Call reading is strong evidence that a significant bottom may have been made on June 16th. Could the SPX break this support and reach stronger Fibonacci support in the 2000 area? Yes, but it would probably require something scary — perhaps the Brexit vote on June 23, 2016. |
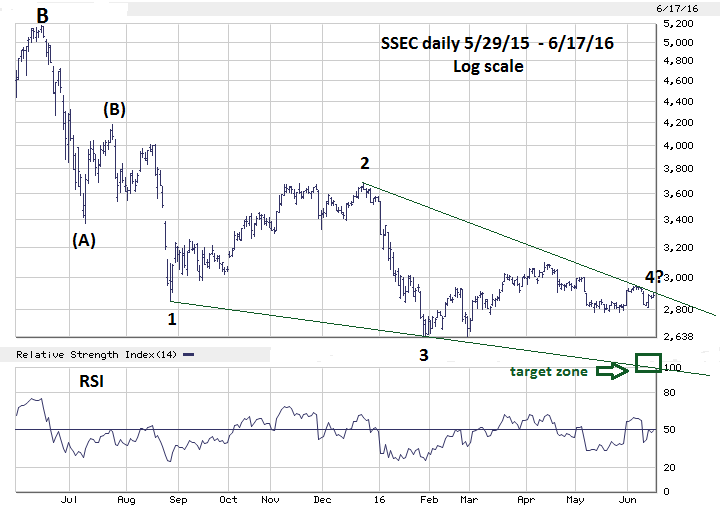
| Shanghai Composite Long Term Update My "Shanghai Surprise" article on April 27th noted the Shanghai composite (SSEC) had appeared to be forming an Elliott wave Ending Diagonal Triangle (EDT) from its peak made in July of 2015. Please see the daily SSEC chart 5/19/15 - 6/17/16 illustrated in Figure 1. The SSEC decline of 49% from its June 2015 peak to its January 2016 bottom makes it one of the weakest stock indexes in the world. Because of the many variables required to form an EDT, they are excellent structures to forecast market turns. The size of the supposed SSEC - EDT is larger than average, lasting more than eleven months. If this wave count is correct and does bottom in the target zone 2400 - 2500 the subsequent rally could last several months. If one of the weakest stock indexes in the world was to have a multi month rally there is a good chance that just about every stock index in the world will follow in its wake. Even if you have no interest in trading any funds or stocks related to the SSEC, what happens to this index in the next few weeks could have a profound impact on your trading portfolio. |
|
| Figure 1. Because of the many variables required to form an EDT, they are excellent structures to forecast market turns. |
| Graphic provided by: BigCharts.com. |
| |
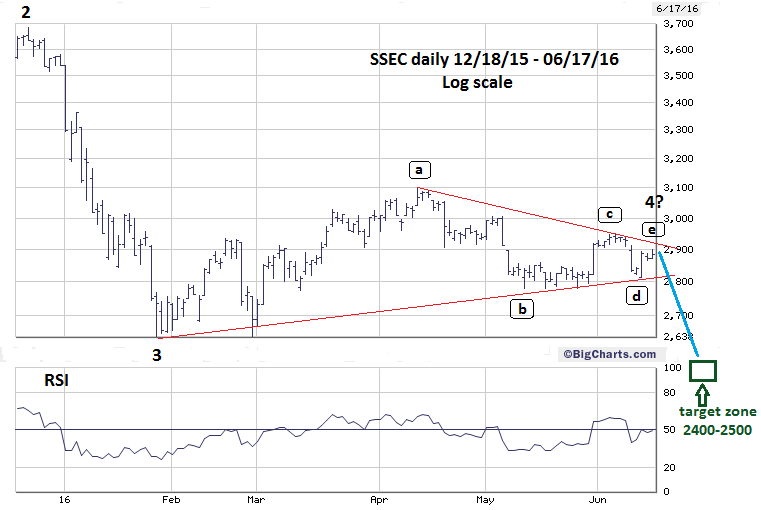
| Shanghai Composite Short Term Update In my June 15th article I speculated that the supposed wave "4" of the EDT could be forming an Elliott wave Horizontal Triangle. Please see the SSEC daily chart 12/18/15 - 6/17/16 illustrated in Figure 2. As of June 17th the Horizontal Triangle counts as complete. If so, very soon there could be a sharp break to the downside with a target zone 2400 - 2500 for what could be a very significant bottom. Because the SSEC has been so much weaker than the SPX, an SSEC bottom would likely occur a few days after the SPX. |
|
| Figure 2. As of June 17th the Horizontal Triangle counts as complete. |
| Graphic provided by: BigCharts.com. |
| |
| Strategy My June 15th article recommended adding to long positions in mid-June with a stop sell for any add-ons at SPX 1970. If the SPX can reach the major support level near 2000 it would probably be after the Brexit vote. As noted in the prior article, the SPX since April 20th has been moving in time segments related to the Fibonacci sequence. Thirteen trading days after the June 8th peak targets June 27th; this is the bulls-eye date for a possible bottom near 2000. With all the hype and countdown clocks regarding Brexit, if the result is considered "bad" it's a good guess that traders that rely primarily on fundamental analysis will be selling. Traders that use technical analysis will have the advantage, we can quantify our risk because we know there's support in the low 2000 area. If there's a Brexit stock sell off, let the fundamentalists do the panicking. We technicians will keep cool, place our stops and buy into what may turn out to be another profit opportunity. Further Reading: Frost A.J and Robert Prechter (1985) "Elliott Wave Principle", New Classics Library. |
Independent investment advisor, trader and writer. He has written articles for Technical Analysis of Stocks & Commodities, Traders.com Advantage,Futuresmag.com and, Finance Magnates. Author of website Four Dimension Trading.
| Website: | www.fourdimensiontrading.com |
| E-mail address: | markrivest@gmail.com |
Click here for more information about our publications!
PRINT THIS ARTICLE

Request Information From Our Sponsors
- StockCharts.com, Inc.
- Candle Patterns
- Candlestick Charting Explained
- Intermarket Technical Analysis
- John Murphy on Chart Analysis
- John Murphy's Chart Pattern Recognition
- John Murphy's Market Message
- MurphyExplainsMarketAnalysis-Intermarket Analysis
- MurphyExplainsMarketAnalysis-Visual Analysis
- StockCharts.com
- Technical Analysis of the Financial Markets
- The Visual Investor
- VectorVest, Inc.
- Executive Premier Workshop
- One-Day Options Course
- OptionsPro
- Retirement Income Workshop
- Sure-Fire Trading Systems (VectorVest, Inc.)
- Trading as a Business Workshop
- VectorVest 7 EOD
- VectorVest 7 RealTime/IntraDay
- VectorVest AutoTester
- VectorVest Educational Services
- VectorVest OnLine
- VectorVest Options Analyzer
- VectorVest ProGraphics v6.0
- VectorVest ProTrader 7
- VectorVest RealTime Derby Tool
- VectorVest Simulator
- VectorVest Variator
- VectorVest Watchdog
 Follow
us on Twitter
Follow
us on Twitter
DEPARTMENTS: Advertising | Editorial | Circulation | Contact Us | BY PHONE: (206) 938-0570
PTSK — The
Professional Traders' Starter Kit
Home — S&C
Magazine | Working
Money Magazine | Traders.com
Advantage | Online Store | Traders’ Resource
Add a Product
to Traders’ Resource | Message
Boards | Subscribe/Renew | Free
Trial Issue | Article
Code | Search
Copyright © 1982–2024 Technical Analysis, Inc. All rights reserved. Read our disclaimer & privacy statement.